NASA’s budget: from 4.4 percent of federal spending to 0.35 percent
In 1966 NASA spent 4.4 cents of every federal dollar; today about a third of a cent. Where its roughly $25 billion a year goes, how it is decided, and why Congress keeps rejecting an $18.8 billion request.
NASA/Aubrey Gemignani
Drawn from 12 sources: NASA (3), Office of Management and Budget (2), Government Accountability Office (2), SpacePolicyOnline (2) and 3 others. About 5 minutes. Checked October 1, 2026.
For fiscal year 2026, Congress gave NASA $24.44 billion in regular appropriations. For fiscal year 2027, the President asked for $18.83 billion, a cut of about 23 percent. The fiscal year began on October 1, 2026, without a NASA appropriation: a continuing resolution signed on September 2 keeps the agency funded at its 2026 rate through December 11, 2026, while Congress decides.1,3,9
Apollo took 4.4 percent of federal spending; today NASA takes a third of one percent

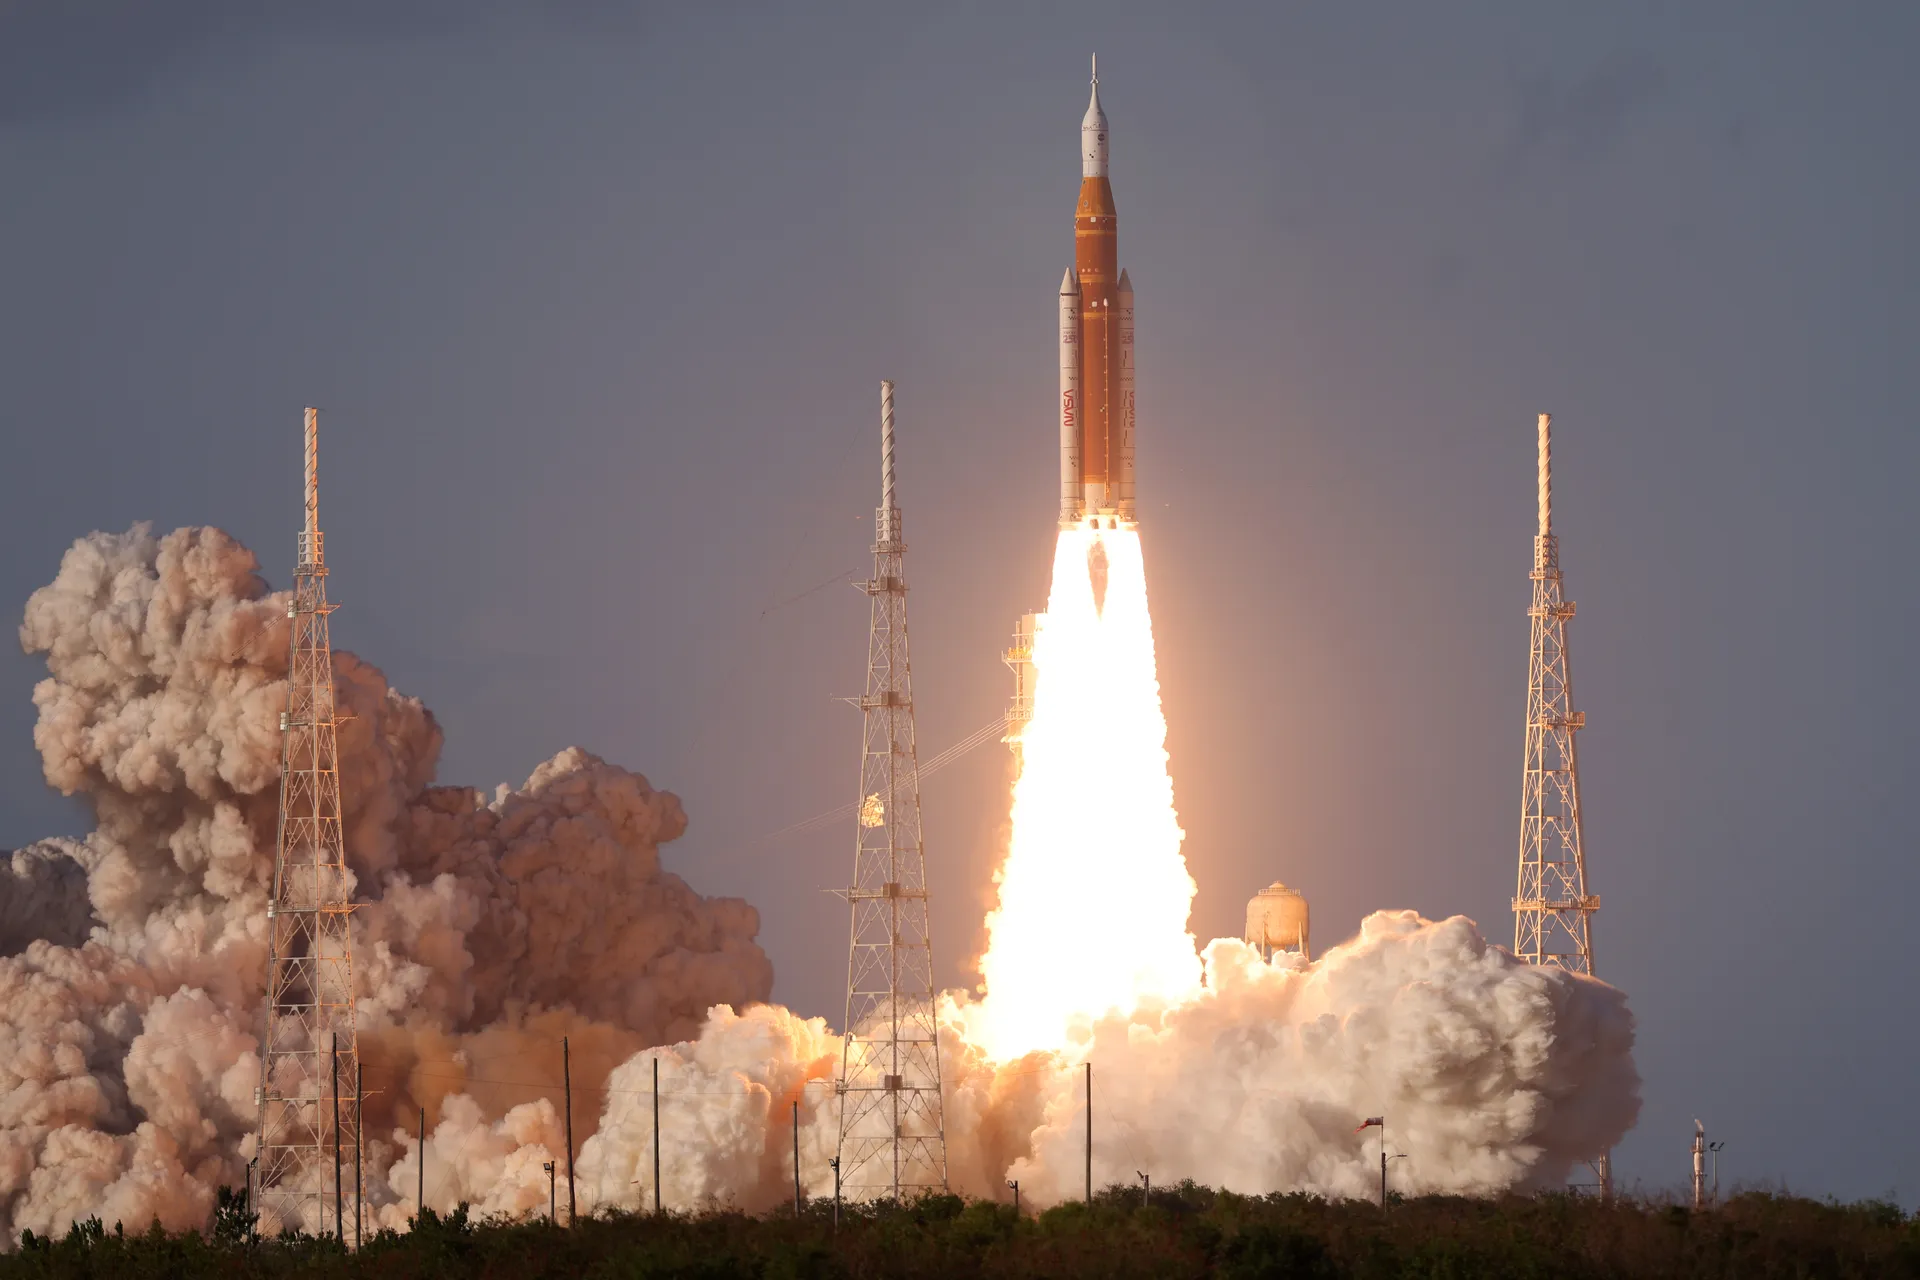
When NASA opened in October 1958, it inherited the NACA’s annual budget of $100 million. After Kennedy’s Moon decision, its budget grew from $966.7 million in fiscal 1961 to $5.1 billion in 1964 and stayed near that level for three more years.8 Measured by what the Treasury actually paid out, NASA’s spending peaked in fiscal 1966 at $5.93 billion. That was 4.41 percent of all federal outlays. In 2025 dollars it was about $45 billion.4,5
NASA spending, 1962–20254
Show the numbers
| year | In 2025 dollars | In dollars of the day |
|---|---|---|
| 1962 | $10.2B | $1.3B |
| 1963 | $20.5B | $2.6B |
| 1964 | $33.1B | $4.2B |
| 1965 | $39.7B | $5.1B |
| 1966 | $45.3B | $5.9B |
| 1967 | $40.2B | $5.4B |
| 1968 | $33.8B | $4.7B |
| 1969 | $29.1B | $4.3B |
| 1970 | $24.4B | $3.8B |
| 1971 | $20.9B | $3.4B |
| 1972 | $20.2B | $3.4B |
| 1973 | $18.7B | $3.3B |
| 1974 | $17.2B | $3.3B |
| 1975 | $15.6B | $3.3B |
| 1976 | $16.4B | $3.7B |
| 1977 | $16.7B | $4B |
| 1978 | $16.3B | $4.2B |
| 1979 | $15.8B | $4.4B |
| 1980 | $16.5B | $5B |
| 1981 | $16.8B | $5.5B |
| 1982 | $17.4B | $6.2B |
| 1983 | $18.6B | $6.9B |
| 1984 | $18.5B | $7.1B |
| 1985 | $18.4B | $7.3B |
| 1986 | $18.4B | $7.4B |
| 1987 | $18.4B | $7.6B |
| 1988 | $21.4B | $9.1B |
| 1989 | $24.9B | $11B |
| 1990 | $27.1B | $12.4B |
| 1991 | $29.2B | $13.9B |
| 1992 | $28.6B | $14B |
| 1993 | $28.7B | $14.3B |
| 1994 | $26.9B | $13.7B |
| 1995 | $25.7B | $13.4B |
| 1996 | $26.2B | $13.9B |
| 1997 | $26.6B | $14.4B |
| 1998 | $26B | $14.2B |
| 1999 | $24.6B | $13.6B |
| 2000 | $23.8B | $13.4B |
| 2001 | $24.4B | $14.1B |
| 2002 | $24.5B | $14.4B |
| 2003 | $24.4B | $14.6B |
| 2004 | $24.7B | $15.2B |
| 2005 | $24.7B | $15.6B |
| 2006 | $23.2B | $15.1B |
| 2007 | $23.6B | $15.9B |
| 2008 | $26B | $17.8B |
| 2009 | $27.7B | $19.2B |
| 2010 | $27.1B | $18.9B |
| 2011 | $24.8B | $17.6B |
| 2012 | $23.7B | $17.2B |
| 2013 | $23B | $17B |
| 2014 | $22.8B | $17.1B |
| 2015 | $24.1B | $18.3B |
| 2016 | $24.6B | $18.8B |
| 2017 | $24B | $18.7B |
| 2018 | $24.8B | $19.8B |
| 2019 | $24.9B | $20.2B |
| 2020 | $26.2B | $21.5B |
| 2021 | $26.2B | $22.3B |
| 2022 | $25.4B | $23.1B |
| 2023 | $26.6B | $25.3B |
| 2024 | $25.7B | $25B |
| 2025 | $24.6B | $24.6B |
The decline after Apollo was as steep as the rise. With the Vietnam War and domestic problems changing the political climate, NASA’s fiscal 1970 budget was cut to $3.7 billion, and the last three Apollo landings were canceled.8 In constant dollars NASA’s spending fell by almost two-thirds between 1966 and 1975 and stayed near that floor through the Shuttle’s development. It recovered after the Challenger accident, peaked again in 1991 at about $29 billion in today’s money, and has moved within a narrow band of roughly $23 billion to $29 billion ever since.4,5
NASA’s share of all federal outlays4
Show the numbers
| year | Share of federal outlays |
|---|---|
| 1962 | 1.18% |
| 1963 | 2.29% |
| 1964 | 3.52% |
| 1965 | 4.31% |
| 1966 | 4.41% |
| 1967 | 3.45% |
| 1968 | 2.65% |
| 1969 | 2.31% |
| 1970 | 1.92% |
| 1971 | 1.61% |
| 1972 | 1.48% |
| 1973 | 1.35% |
| 1974 | 1.21% |
| 1975 | 0.98% |
| 1976 | 0.99% |
| 1977 | 0.98% |
| 1978 | 0.91% |
| 1979 | 0.87% |
| 1980 | 0.84% |
| 1981 | 0.82% |
| 1982 | 0.83% |
| 1983 | 0.85% |
| 1984 | 0.83% |
| 1985 | 0.77% |
| 1986 | 0.75% |
| 1987 | 0.76% |
| 1988 | 0.85% |
| 1989 | 0.96% |
| 1990 | 0.99% |
| 1991 | 1.05% |
| 1992 | 1.01% |
| 1993 | 1.01% |
| 1994 | 0.94% |
| 1995 | 0.88% |
| 1996 | 0.89% |
| 1997 | 0.9% |
| 1998 | 0.86% |
| 1999 | 0.8% |
| 2000 | 0.75% |
| 2001 | 0.76% |
| 2002 | 0.72% |
| 2003 | 0.68% |
| 2004 | 0.66% |
| 2005 | 0.63% |
| 2006 | 0.57% |
| 2007 | 0.58% |
| 2008 | 0.6% |
| 2009 | 0.54% |
| 2010 | 0.55% |
| 2011 | 0.49% |
| 2012 | 0.49% |
| 2013 | 0.49% |
| 2014 | 0.49% |
| 2015 | 0.49% |
| 2016 | 0.49% |
| 2017 | 0.47% |
| 2018 | 0.48% |
| 2019 | 0.45% |
| 2020 | 0.33% |
| 2021 | 0.33% |
| 2022 | 0.37% |
| 2023 | 0.41% |
| 2024 | 0.37% |
| 2025 | 0.35% |
The share fell further than the dollars because the rest of the federal budget grew. In 1966 NASA spent $5.93 billion out of $134.5 billion in federal outlays. In 2025 it spent $24.58 billion out of $7.01 trillion—0.35 percent. NASA’s nominal budget has been roughly flat at about $24 billion to $25 billion since fiscal 2023, which means a real decline once inflation is counted: in 2025 dollars, its 2025 spending was about $2 billion below 2023’s, and OMB’s estimate for 2026 is lower still.4,5
Request, appropriation, obligation, outlay
“NASA’s budget” can mean four different things, and each answers a different question. The President’s budget request proposes funding and priorities for a fiscal year that begins on October 1. Congress then provides budget authority—the legal authority to incur financial obligations that will result in outlays—through an appropriations act; for NASA that is the Commerce, Justice, Science bill. An obligation is a binding agreement, such as a contract, that will require payment. An outlay is the payment itself.6
When Congress has not finished its appropriations by October 1, it can pass a continuing resolution, which provides budget authority for a limited time, usually at the previous year’s rate. A contract signed this year can draw payments for years afterward, so the outlays in the charts above lag the decisions behind them. A contract’s announced value is neither an appropriation nor a payment; the money is obligated and paid out over time.6
Where $24.4 billion goes
NASA appropriations by account, fiscal year 20261
Show the numbers
| account | FY2026 enacted |
|---|---|
| Exploration (Artemis) | $7.78B |
| Science | $7.25B |
| Space Operations | $4.18B |
| Mission support | $3B |
| Aeronautics | $0.94B |
| Space Technology | $0.92B |
| Construction | $0.19B |
| STEM Engagement | $0.14B |
| Inspector General | $0.05B |
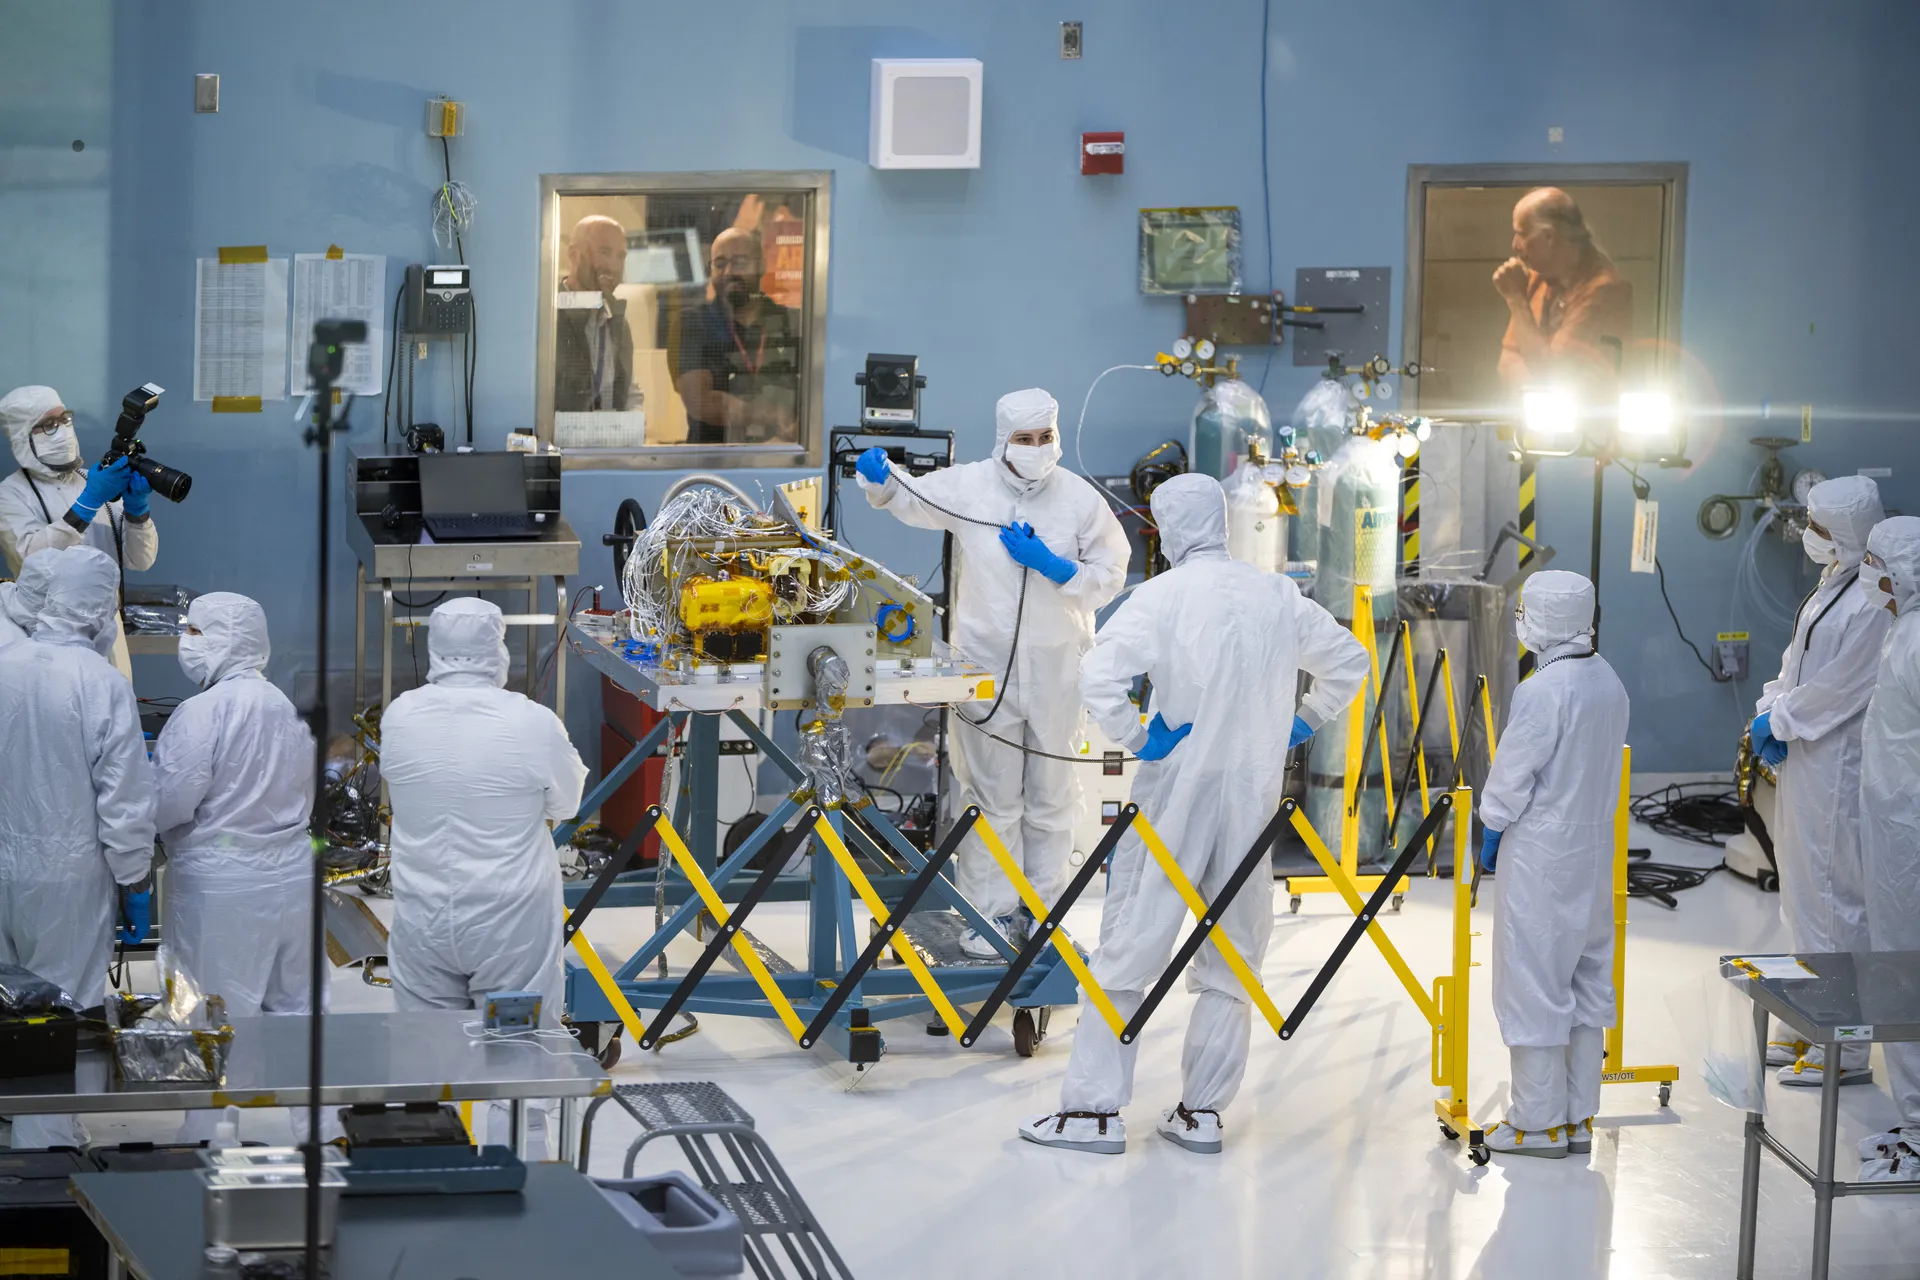
The two largest accounts are almost equal. Exploration—$7.78 billion in 2026—pays for Artemis: $1.42 billion for Orion, $1.31 billion for the Space Launch System and $923 million for the ground systems at Kennedy, plus lunar landers, spacesuits and the rest of the lunar architecture. Science—$7.25 billion—is divided among Earth science ($2.15 billion), planetary science ($2.54 billion), astrophysics ($1.60 billion), heliophysics ($875 million) and biological and physical sciences.1
Space Operations, $4.18 billion, runs the International Space Station ($1.24 billion), buys crew and cargo flights to it, supports the networks that communicate with spacecraft, and funds commercial successors to the station ($273 million). Safety, Security and Mission Services, $3.0 billion, is what NASA calls mission-enabling, foundational support—information technology, protective services and the operation of its centers. Aeronautics, Space Technology, construction, STEM Engagement and the Inspector General make up the rest.1,2,3
Ten billion dollars outside the annual budget
Congress also used the 2025 reconciliation law, Public Law 119-21, signed on July 4, 2025, to give NASA mandatory appropriations totaling $9.995 billion, available until September 30, 2032. NASA plans to obligate $2.11 billion of it in fiscal 2027.3 The law specified its uses: $4.1 billion for SLS rockets for Artemis IV and V, $2.6 billion for the Gateway lunar station, $1.25 billion for the space station, $700 million for a Mars telecommunications orbiter, $325 million for the station’s deorbit vehicle, and $1 billion for infrastructure at the human spaceflight centers, $85 million of it to move a retired crewed spacecraft for display, a provision aimed at bringing the Space Shuttle Discovery to Houston.12 Because some of that money is assigned to later years, CRS counts about $4 billion of it in NASA’s 2026 budget authority, which brings the agency’s total for the year to $28.45 billion.1
An $18.8 billion request, two years running
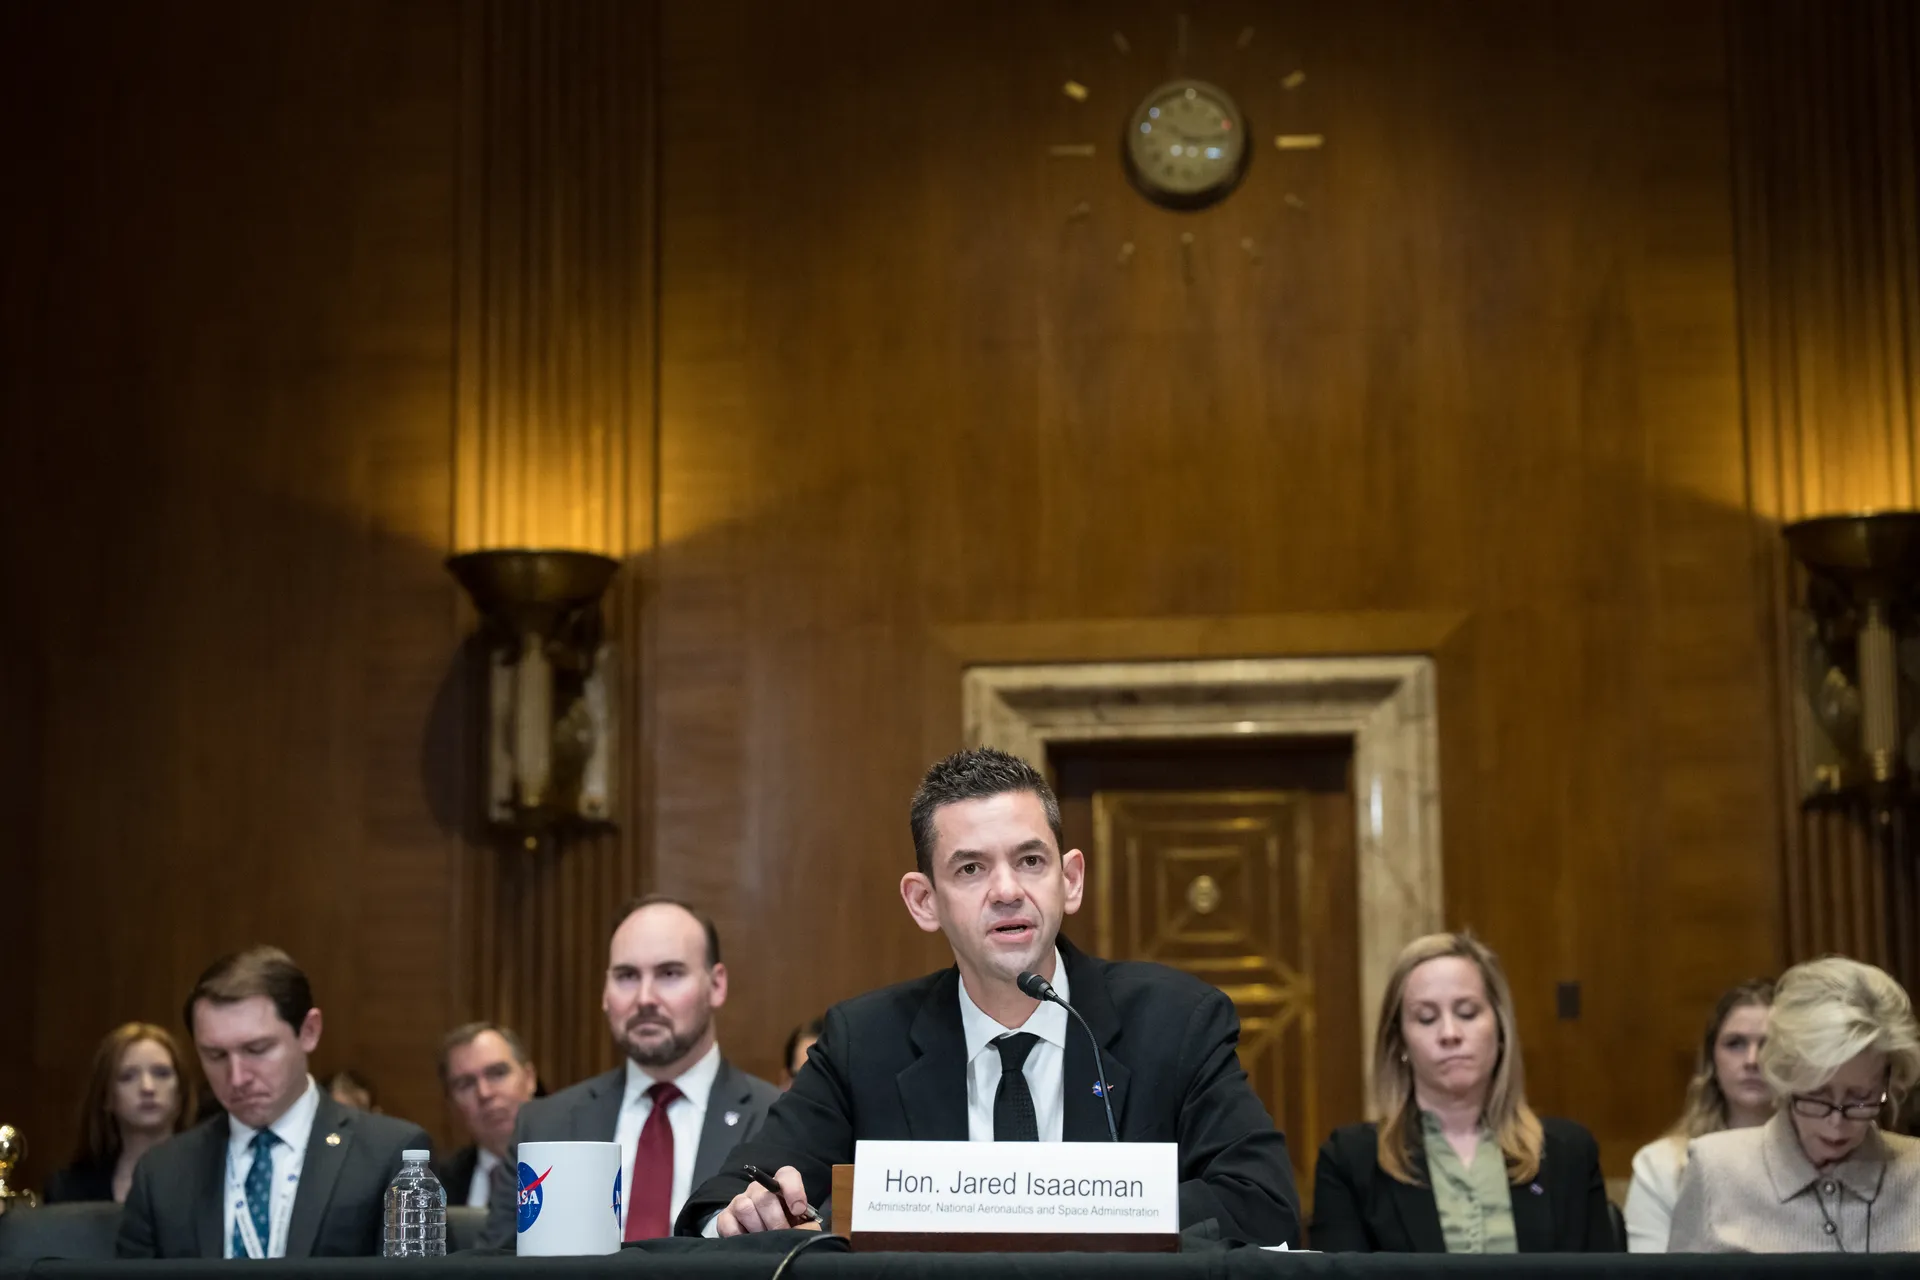
Administrator Jared Isaacman defends the fiscal 2027 request before the Senate appropriations subcommittee for Commerce, Justice and Science, April 28, 2026.
The President’s request for fiscal 2026 was $18.81 billion. Congress rejected it: the House committee bill provided $24.84 billion, the Senate committee bill $24.90 billion, and the enacted law, signed in January 2026, $24.44 billion. Science, which the request would have cut to $3.91 billion, received $7.25 billion.1
The fiscal 2027 request, released on April 3, 2026, repeats the $18.8 billion topline and holds it flat through 2031. It would raise Exploration to $8.5 billion to accelerate Artemis and a permanent lunar base, cut Science to $3.9 billion, reduce mission support to $2.0 billion and end funding for the Office of STEM Engagement.2,3
FY2026 enacted and FY2027 request, by account2
Show the numbers
| account | FY2026 enacted | FY2027 request |
|---|---|---|
| Exploration | $7.8B | $8.5B |
| Science | $7.3B | $3.9B |
| Space Ops | $4.2B | $3.1B |
| Mission support | $3B | $2B |
| Aeronautics | $0.9B | $0.6B |
| Space Tech | $0.9B | $0.6B |
The Planetary Society counted 53 science missions likely to be terminated under the request, with a combined lifetime cost of $13.2 billion, and calculated that, adjusted for inflation, it would give NASA “the smallest budget for the space agency since 1961.”11 In May 2026 the House Appropriations Committee again rejected the cut, approving $24.4 billion, flat with 2026, with $6 billion for Science and a provision barring NASA from moving money away from SLS until a commercial alternative is proven.10 The Senate Commerce Committee’s authorization bill, S. 933, would set the 2027 level at $25.29 billion.1 No 2027 appropriation had passed by October 1, so the continuing resolution, Public Law 119-103, holds NASA at its 2026 level through December 11.9
Where overruns concentrate: GAO’s review of 36 major projects
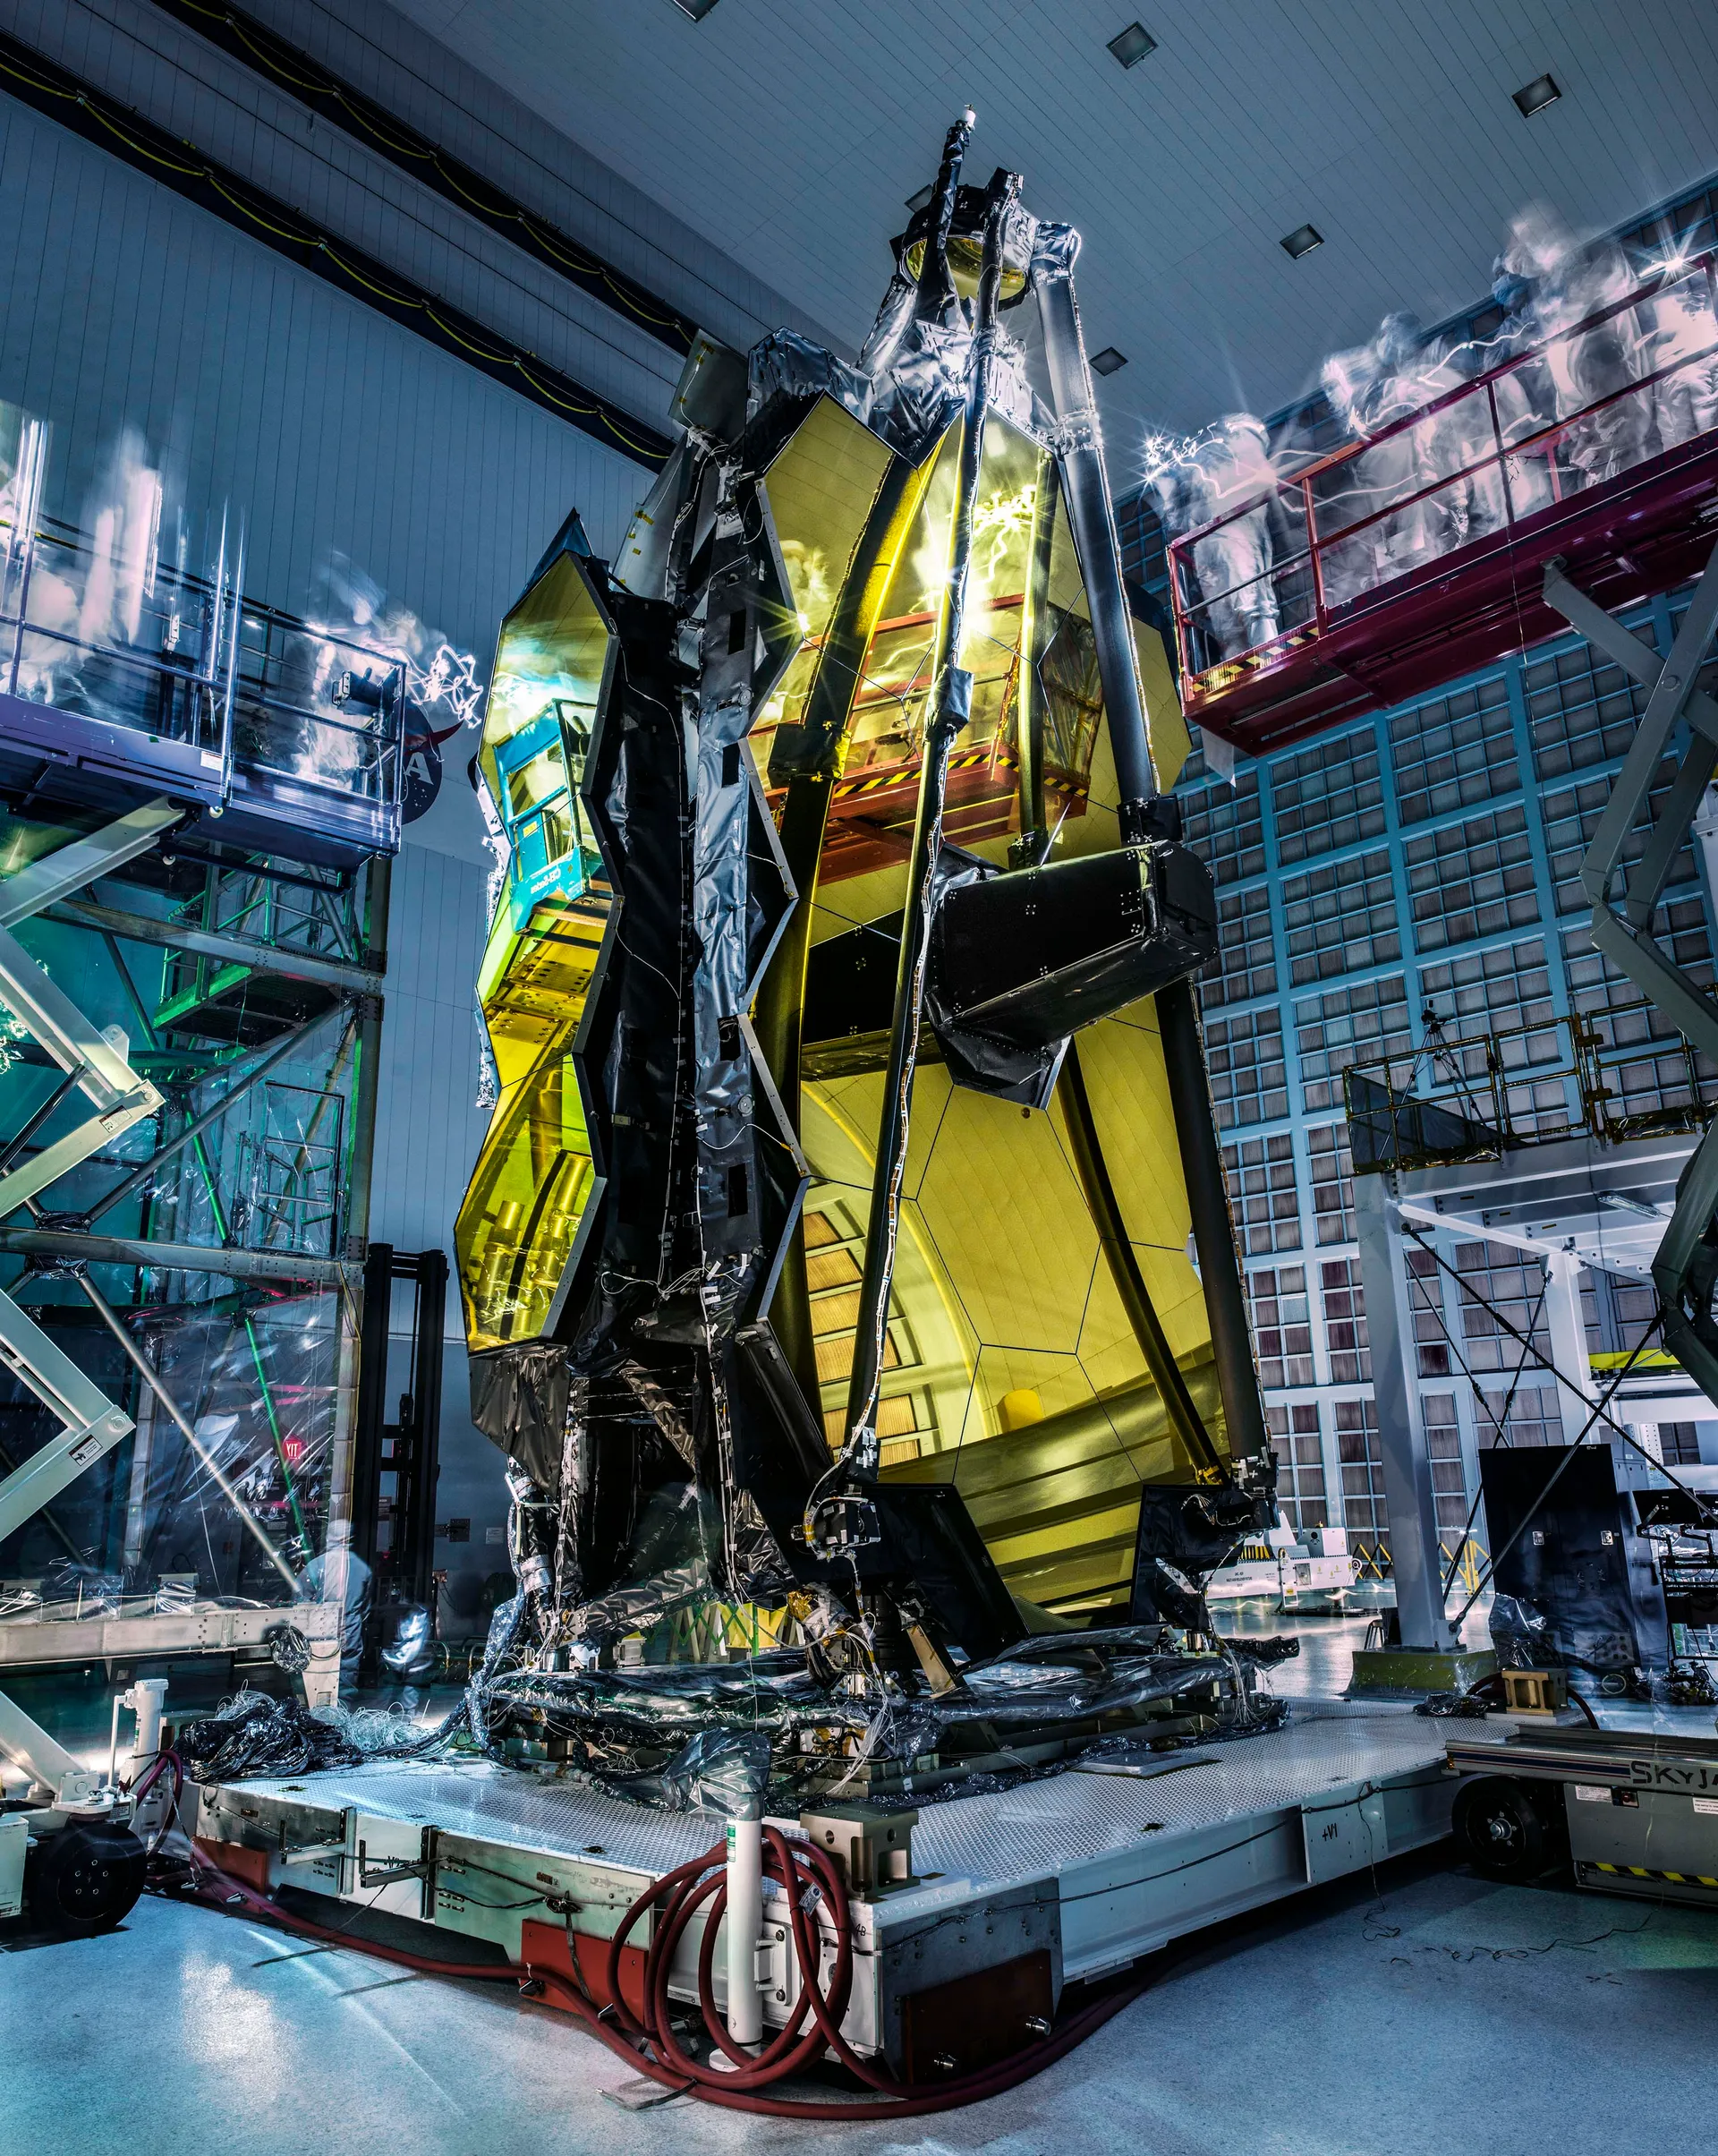
Most of NASA’s money flows through a portfolio of large development projects, which the Government Accountability Office assesses every year. In its 18th annual review, published in July 2026, GAO found that NASA was managing at least $70 billion in estimated life-cycle costs across 36 major projects. Of the 18 projects it measured against cost and schedule targets, only two had schedule delays in the past year, totaling two months, and three reported cost overruns totaling $501.4 million. The portfolio’s cumulative overruns rose from $4.4 billion to nearly $4.7 billion, and its cumulative delays from 13.1 years to 14 years.7
One project dominates those figures: the Orion crew capsule accounts for more than half of the major projects’ annual cost overruns and almost 75 percent of their cumulative overruns. GAO also found that NASA cut its civil-service workforce by 4,000 people—nearly 22 percent—in 2025, and that the reductions affected 25 of the 36 projects. The proposed 2027 cut of more than 20 percent, it noted, adds to uncertainty about whether NASA can rehire the skills it lost.7
At the 2026 rate the continuing resolution preserves, NASA spends about $24 billion a year in today’s dollars—a little more than half of what it spent at the Apollo peak, from a federal budget about seven times larger in real terms.4,5
Sources
The text above is drawn from these 12 sources. Government works are adapted closely; company and press material is summarized. Numbers in the text point here. Last checked October 1, 2026.
Show all 12 sourcesShow fewer
Continue
Related stories
- The buildersNASA has always spent most of its money outside its own walls. From Apollo’s 500 contractors to SpaceX and Blue Origin, the question that shapes every program is who carries the risk when costs grow.
- The birth of NASAIn the year after Sputnik, Congress and President Eisenhower built a civilian space agency on the NACA’s laboratories, then gave it a Navy satellite, an Army rocket team and, by 1961, the Moon.
- ApolloKennedy’s 1961 goal became a program of 400,000 people and more than 500 contractors. It chose a risky route to the Moon, survived a fire on the pad, and landed six crews before Congress ended it.